I opted in for the optional session on becoming an Autograph Trainer, which included lots of little tips on how to use Autograph to its best, and also how to run a training session. For a two hour session, there were so many ideas that it certainly got me thinking straight away. Some of the most useful buttons (some of which I didn't know about before, and others that I hadn't realised the full potential of) are shown below:
 the Default Scale button will adjust the scale to fit the graph as best as possible.
 the Whiteboard Mode setting, which makes all the lines a little thicker, and allows you to select multiple items by just clicking on them one at a time.
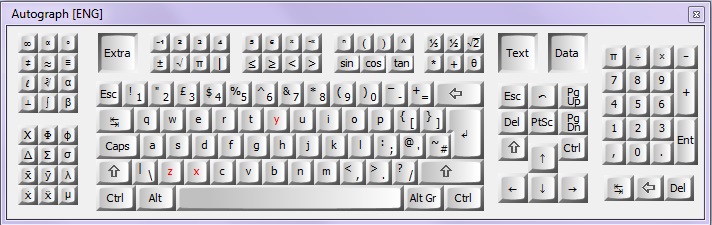
 the onscreen Keyboard which pops up and allows you to not only enter equations from the board, but also has symbols for many common mathematical symbols which can be used in any program. This can also be opened independently of Autograph from the Start menu.
 the Slow Plot function, that can be used to plot a graph slowly, starting from negative x values.
 the Constant Controller which allows you to adjust constants in equations to see what happens.
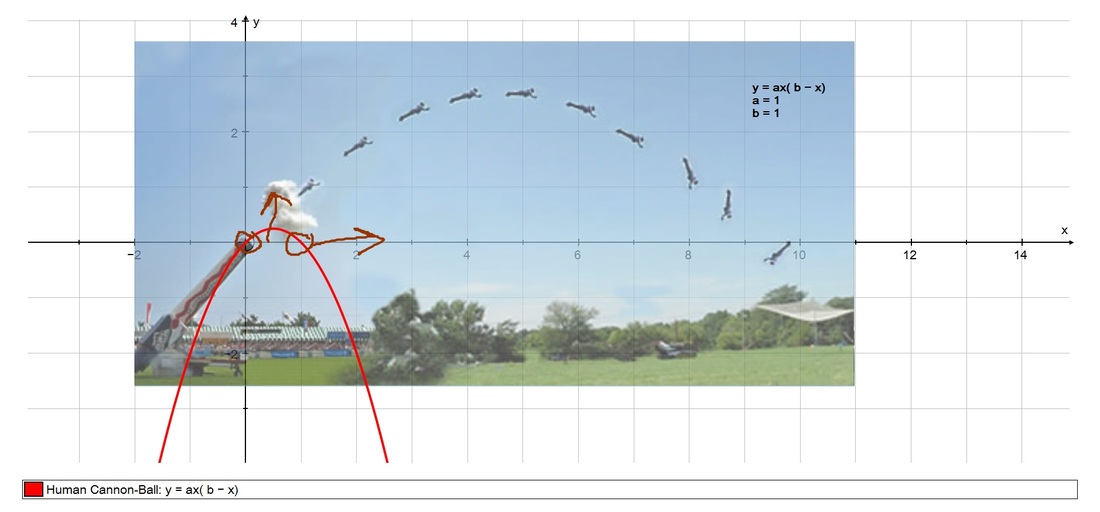
 the Scribble pen which allows you to write all over the Autograph screen, and easily mark predictions.
Session 1
With the introductions over, we were thrown into the first 2 hour session for our chosen workshop. Before we had even started, our tutor (David McGee) had asked us to make sure we were signed up to several services: wix.com; dropbox; google drive; Edmodo. These would prove to be hugely beneficial in our sessions for sharing things we had done easily and quickly. Throughout the sessions we used dropbox and Edmodo to get at files that David had made available in these two areas, and it certainly saved times from emailing it everybody.
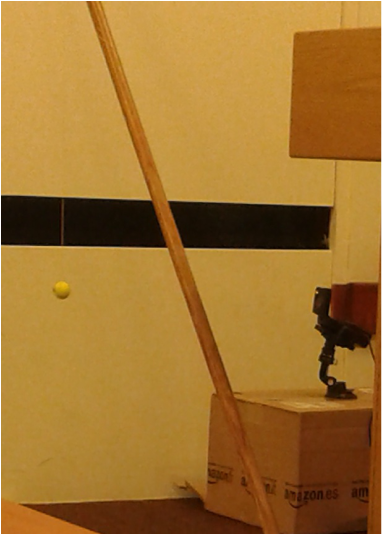 Vernier Go! Motion recording data for a swinging ball. | 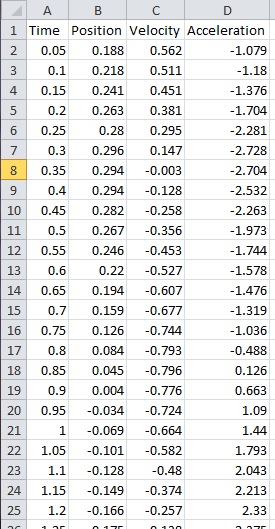 A sample of the data recorded from the swinging pendulum. |
With this data, we can plot the displacement-time graph in Autograph by copying the two columns of data (Time and Position), and using the  Enter XY Data Set.. button in Autograph, pasting the data in the table that appears.
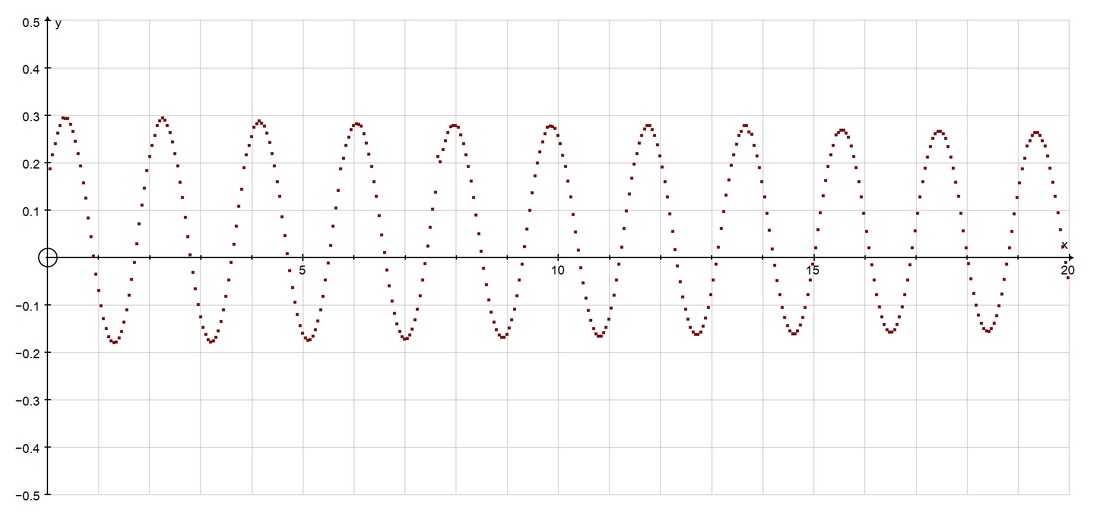
Since this looks something like a sine graph, we can now approximate it with the graph of y = asin(bx+c)+d and then use the Constant Controller to adjust the values of a, b, c and d to get it to fit over the data.
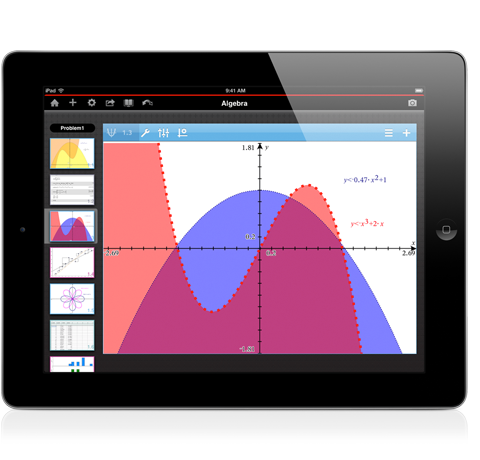
In the second session we looked using wireless tablets (or an iPad) to control what was happening on the screen. An excellent addition (or alternative) to an interactive whiteboard, you can carry a wireless tablet around the room, and even stand at the back of the room whilst writing on the board. You can also then pass it around the room for students to annotate what is on the board. Of course, sometimes you want to get them out of their seats and writing at the actual board, but to have the ability to have them show their solution on the board whilst still sitting at their desk is excellent. The best tablet to buy is the Wacom Bamboo Pen and Touch, with the additional wireless kit. There are apps for the iPad as well, and these were discussed more in Session 3.
In the third session we focussed on two completely different aspects, both of which intrigued me.
- Controlling the whiteboard and what is shown;
- Allowing students to connect and work collaboratively in the classroom;
- Mathematical Apps that are engaging or useful in some way.
The second workshop I attended was using Autograph in the classroom, with the fantastic Mr Barton. These sessions were all run in a similar way, where we were shown some ideas, and then given plenty of time to think about and play with Autograph around the main theme of the session. They were split into themes for the sessions: geometry and shape; statistics and data handling; number and algebra. However, although we were introduced to lots of amazing things you can do with Autograph, I am going to focus on the pedagogical points that came up, as well as some types of activities that Craig showed us.
There are two main ways to use Autograph in the classroom. It can be used to demonstrate or it can be used to investigate. The former of these is a passive activity for the students, whilst the latter is much more active. So the question is, how can we make the demonstrations more engaging, and actively involve the students in them. Here are the main pointers:
- Always get the students to predict what they think will happen. This is probably the single most important aspect of using Autograph (or any other software). This gets the students to think about what will happen, rather than just blindly look and accept. Never forget this.
- Get students to write their answers down. This could be on a mini-whiteboard, the back of their books, or a scrap of paper, but it gets them to formalize what they want to say, and use mathematical notation.
- Get students to justify their thoughts and explain their reasoning to each other. You should not only ask for justifications from the ones who get it right, but also those who get it wrong.
- Use the "wiggle test" by grabbing a particular point and moving it a little bit to show what happens in the image (particularly useful for transformations).
- Use the software to follow the natural progressions that students follow. If looking at something in 2D, why not extend this to 3D.
- When using the Constant Controller, start by using concrete numbers (eg y=x, y=2x) then change to the constant (y=ax). However, before clicking OK, go to "Edit Constants" and change the constant to the value it currently has (in this case 2). When you then click OK, nothing will change, and you can ask for predictions when you change the constant.
- Make use of the Slow Plot and Scribble functions on Autograph.
- Give students a chance to change their mind. This allows them to feel like they are in a safe environment, where they can make mistakes, but learn from them. It is so important that students feel safe, and allowing them to correct themselves will give them confidence to try.
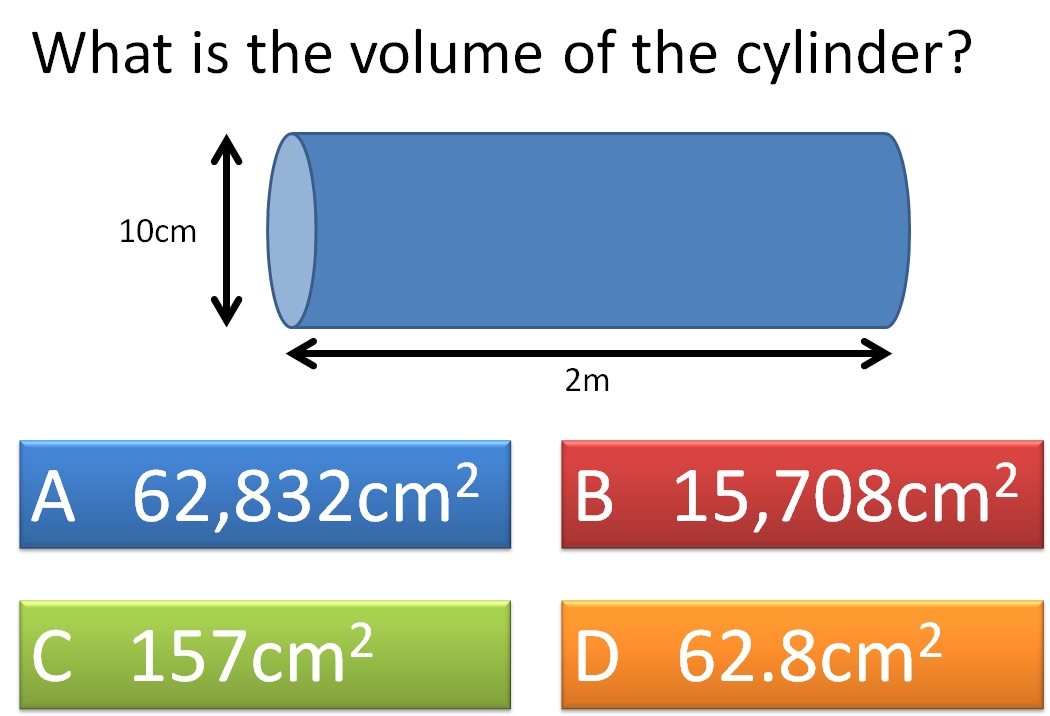
A new project that Craig told us about early on in the sessions is a website he is setting up that will be full of Diagnostic Questions. He described these as multiple choice, closed questions, where each of the three possible incorrect answers reveals a misconception. The theory behind these is that as a teacher you can very quickly identify not only who got it wrong, but why they got it wrong. This also allows you as a teacher to target the students who need the most help, as their misconceptions are the worst.
One of Craig's favourite tasks is a collective memory. The idea is that each team has to recreate an image they are shown for only a limited amount of time (and he explains how to run one in more detail on his site). The important aspects for the learning is that you go through any talking points before revealing the image to the class for them to check. He also suggested printing out a copy of the complete poster for each student, which they can annotate with notes and stick in their books. However, the real power of the examples that he showed use was that they all came from an original Autograph file. So once the activity is done, you can open up the file, and use it to further investigate the properties (remembering to get students to predict outcomes).
Mr Barton loves data handling and statistics, and he does not hide this fact. He talked about many ways to collect interesting data to analyse, with one important underlying message: it must be relevant to the students!
One simple way to do this is to show a slide with a number of dots on it for a second, and ask students to estimate how many there are. This is best done if they write their answers down (perhaps on a form using Google Forms), so they are not changing their mind as they see others answers. With all this data, you can then put it into Autograph as  Raw Data, and create any number of statistical diagrams, such as a
  Box and Whisker Plot. Now you can discuss the features of the plot. After this, get them to have another guess at the total (without showing them again), and again collect the data. Ask them to predict how the Box and Whisker Plot will look with the new data, and then input the data, and check their predictions.
 RSS Feed