I had a really great lesson today. I am teaching IB Standard Level, and they need to know the effects of changing the original data by a linear transformation, and what this does to the mean and the standard deviation of the data.
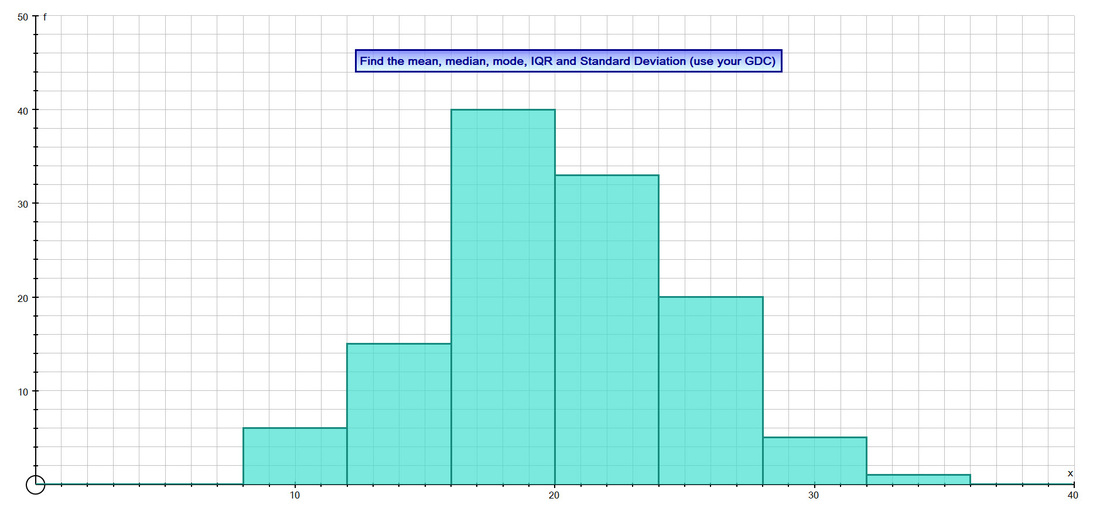
I started with the simple question shown below from Autograph, where I used the raw data function to create a random sample with a normal distribution, and then plotted this as a histogram. I then asked students to calculate the mean, median, mode, IQR and standard deviation of the data. We also discussed the fact that this was an estimate as the data was grouped, and compared these statistics with the statistics of the raw data using Autographs statistics box.
After this we got into the main part of the lesson, and I have made a brief video explaining how to use Autograph to investigate what happens to the statistics of data as you perform a linear transformation on the original data.
If you would like the Excel file I showed briefly at the end of the video, it can be downloaded here. Just press F9 to generate new questions.
 RSS Feed