Our latest unit with S3 has been on teaching straight line graphs and inequalities. This covers the basics of finding equations of lines from graphs, drawing lines from the equation, finding equations from descriptions (eg gradient and a point), parallel and perpendicular lines, inequalities on the number line, solving linear inequalities and drawing and describing regions on the coordinate plane using inequalities. In this post I am going to talk a little about how I approached this last objective this year.
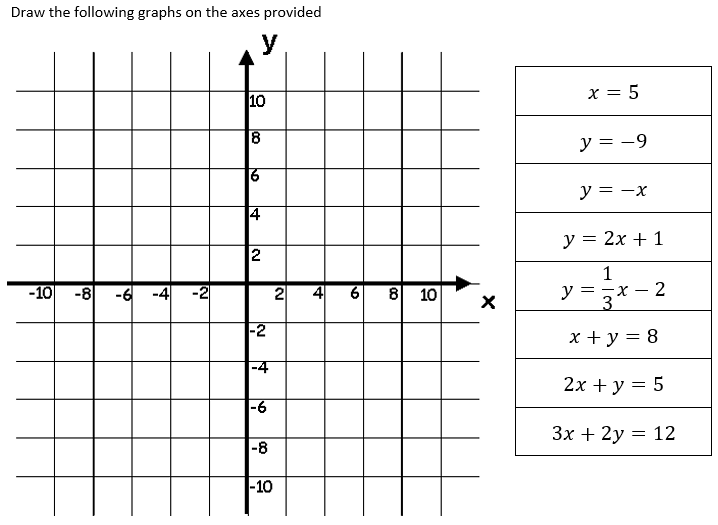
First I checked that all students were able to draw lines from equations, and were relatively confident with this. This had been something we had focused on over the previous couple of weeks, with it popping up in the retrieval starters on a regular basis, so I was not expecting any problems at this point. All students were able to complete this task confidently.
This year I have been focusing on giving appropriate examples (followed by a your turn question) and in trying to break processes down in to the constituent parts. To teach sketching regions given by inequalities, I took some inspiration from the excellent Math = Love blog, and created this template for students to use.
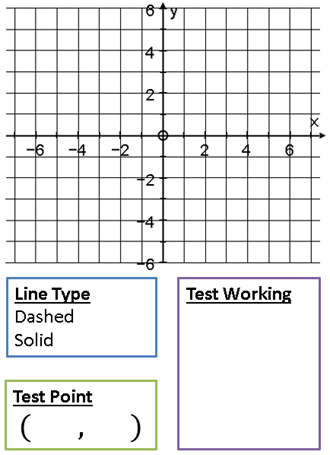
For each example and your turn, I gave students a copy of this template within the work booklet that I print for them.
The broken down structure helped the students to scaffold their thinking in the early acquisition of this skill, by prompting them in to each step. As students gained experience with answering the questions, the template was removed and they had to answer the questions from this Corbett Maths worksheet.
 RSS Feed