In IB Mathematical Studies students have to recognise the Vertex (Completed Square) Form and Root (Factorised) Form of a quadratic function. Although they have a graphical calculator to help them sketch the graphs, they need to know the links in order to find the equation of a given graph. This is utilised in analysing data and creating models that follow a parabola.
In previous years I have taught this through a guided investigation which has students use technology to discover what happens in each of these situations:
- y = ax² - what happens as a changes
- y = x² + c - what happens as c changes
- y = (x + p)² - what happens as p changes
- y = (x + p)² + q - what can we say about this function
- y = (x + m)(x + n) - what can we say about this function
This year I decided to try something a little different, following one of the ideas from the amazing variationtheory.com, the activity type that Craig Barton calls Demonstration (https://variationtheory.com/demonstration/).
Making use of the new whiteboards I have around my room, I had pairs of students make a prediction of what each graph would look like, before revealing the correct answer. Prior to this lesson we had covered sketching parabolas from the graphical calculator, labelling the important points, so I emphasized that students must label these is possible for each graph they sketched.
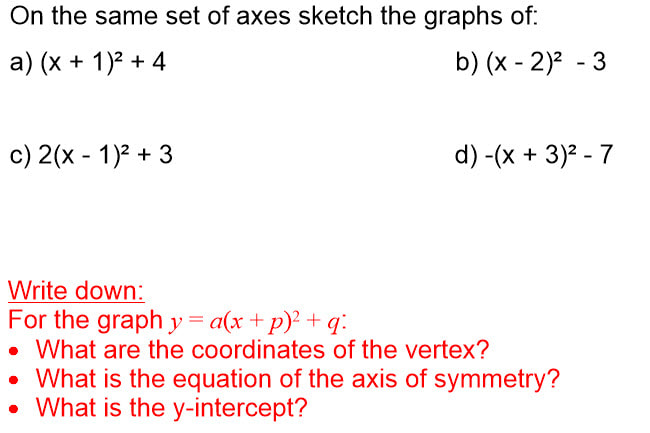
After each "batch" of types of graphs, students returned to their seats, and I projected some example graphs for them to sketch in their notes, and some questions for them to answer. One such of these slides is shown below.
Those students in the group with a stronger prior knowledge of quadratics definitely took more from this lesson, however, there was still lots of confusion amongst the class. Many struggled to predict the y-intercept. Others got hung up on the idea of translations, which whilst being correct was in this instance getting in the way of them identifying the important points.
My guess is this was creating a large cognitive load as they were having to turn an equation into a translation (and sometimes stretch) and then draw this sketch.
At the end of the lesson I felt frustrated. Although to an observer this may have seemed like a good lesson (students were engaged and working for most of the lesson, they were being relatively successful, and it was clearly challenging them), I knew that they had not learned much from the experience. We did not get to look at graphs in Root Form as there was so much confusion around the prior examples, and some in the class could not even perform at the end of the lesson by stating an equation of a given graph.
I decided that I needed to reteach this in a different way.
I decided to go along another path set out by Craig Barton, the Pattern Spot (https://variationtheory.com/pattern/).
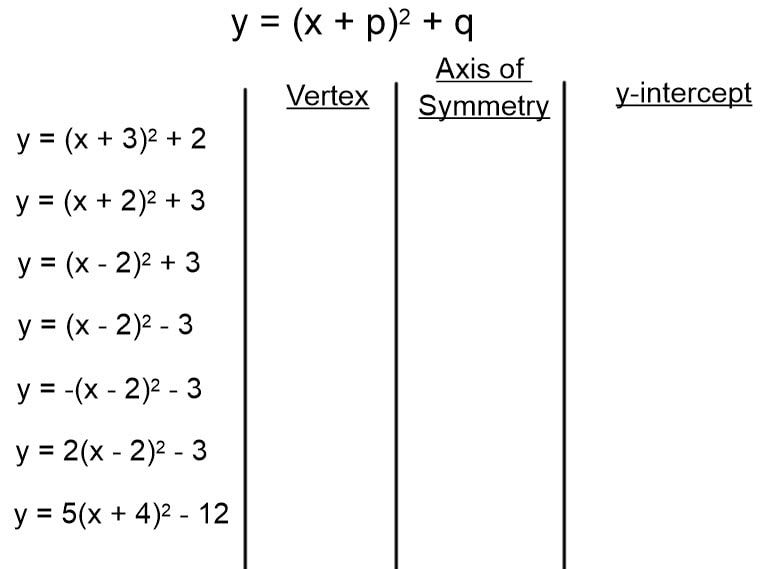
In the following lesson I just showed a blank set of equations in Vertex Form, with three columns next to them, as shown below.
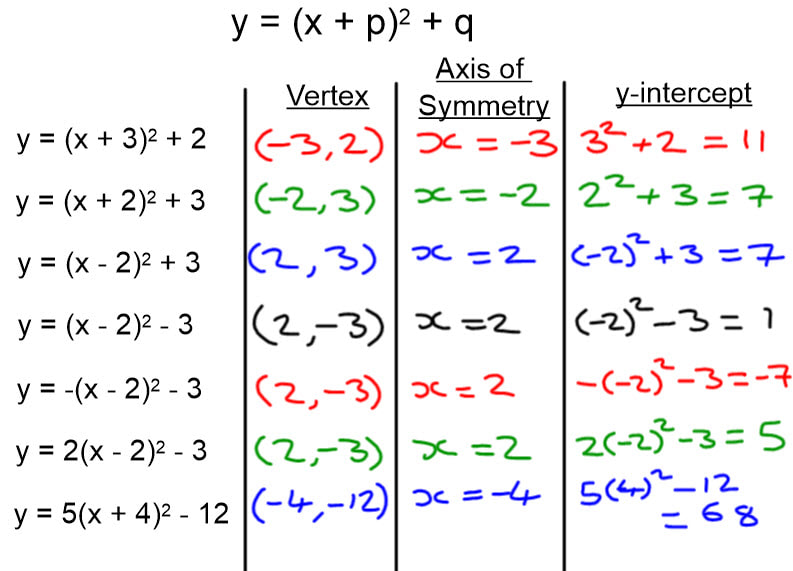
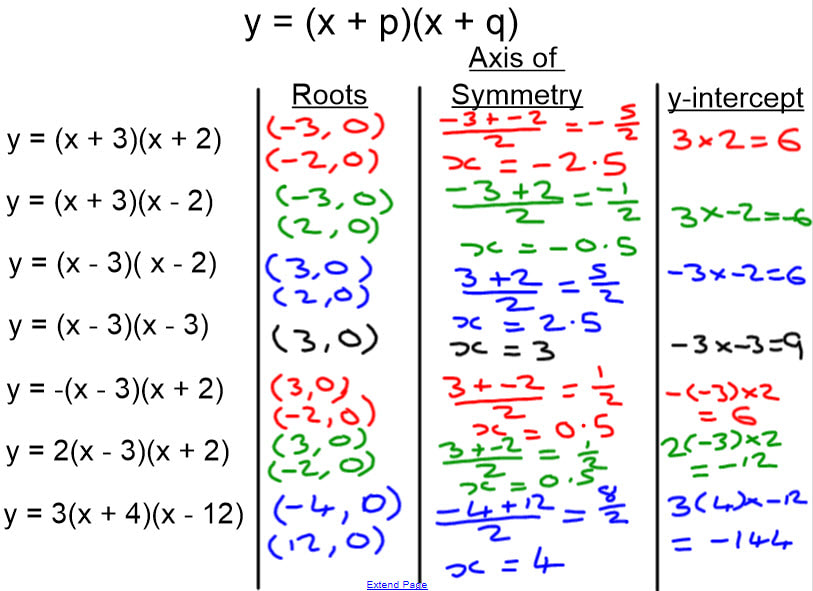
Instructing the students to just watch in silence, I proceeded to fill in each row, pausing slightly between each entry. You can see the final filled in slide below.
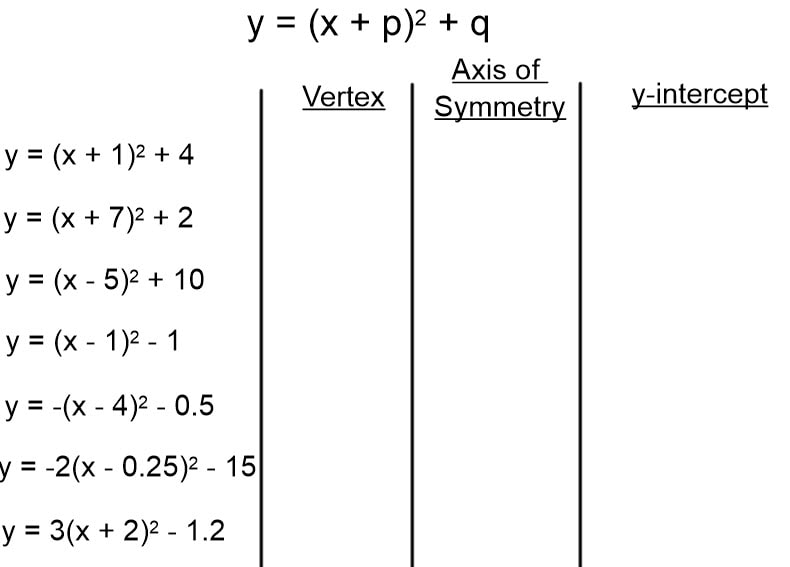
I then revealed the following set of equations, which I showed side by side with the examples, making use of the dual page display option in SMART Notebook.
For those that finished, I challenged them to try to sketch the graphs of the quadratic functions, making use of the information they had just found.
During the process, one student asked what the axis of symmetry was. I decided not to tell them at that stage (not wanting to overload their working memory), and told her that I would explain that once they had completed the questions as I wanted them to focus on how to find it first. She was happy with this answer, and was then the first to complete the questions. The same student then said to me that this was much easier to understand than the graphs we had done previously. I asked if she was now able to make connections between this and the sketching we had previously done, to which she responded yes. I know student self-report can be misleading, but I thought it was an interesting comment in the moment.
After all students had completed the questions, I took the book of one student and projected their answers using my visualiser, and asked if anybody disagreed with any of the answers shown. There was one disagreement, which I clarified on the board.
I then used the whiteboard beside my SMARTboard to sketch one of the graphs, and show students what the axis of symmetry was, and straight away one student noted that it went through the vertex and that was why the value matched the x coordinate of the vertex. How before why definitely seemed to help (at least that) student develop a better understanding.
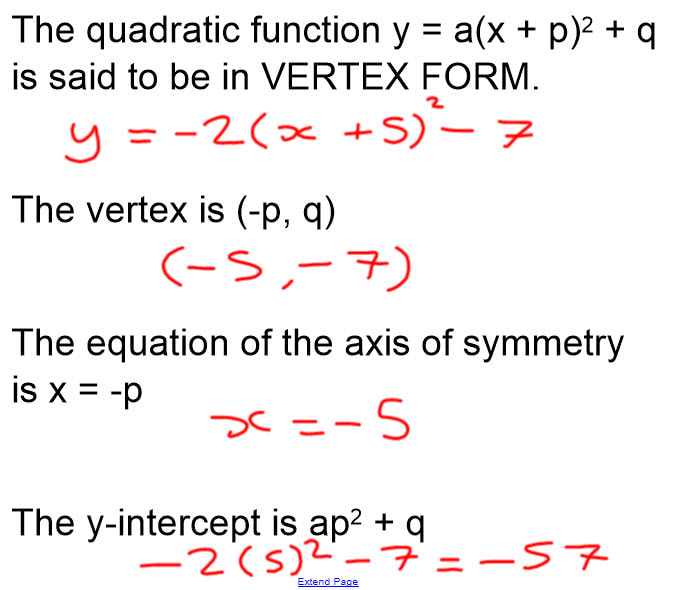
Then we formalised what we had found in written notes, as shown below.
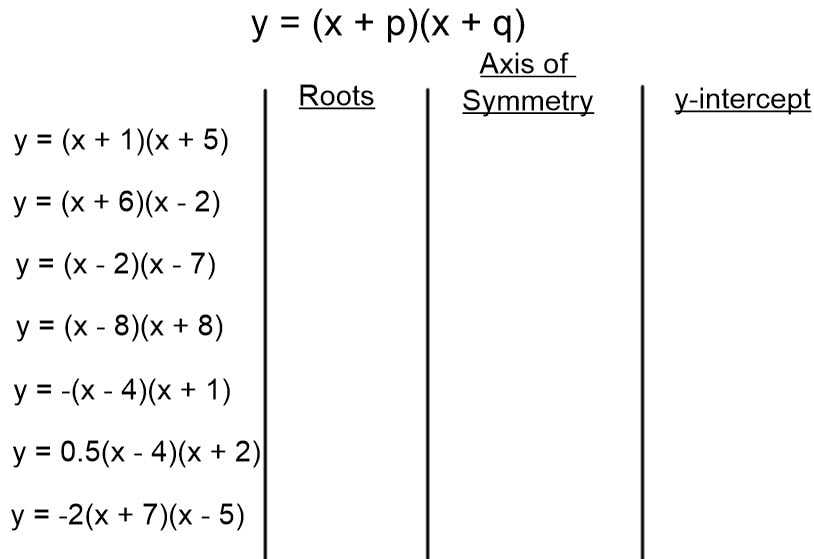
We then repeated the whole process with the Root Form of a quadratic, with the examples I did and the questions they then did shown below.
Originally I had included the vertex in these slides, but decided to remove it to lower the intrinsic cognitive load of the task. As students completed the set of questions, this time I challenged them to find the vertex, using what we had discussed about it a few minutes before.
When they had finished I sketched two parabolas and showed the axis of symmetry. With some encouragement, a student pointed out that it is half way between the roots, and then I linked this to the midpoint formula which they are given in their formulae booklets. We also discussed how we could find the vertex once we knew the axis of symmetry, as the x coordinate is the same (as we had previously discussed), and then use the equation to find the y coordinate (though we will be returning this in more depth soon).
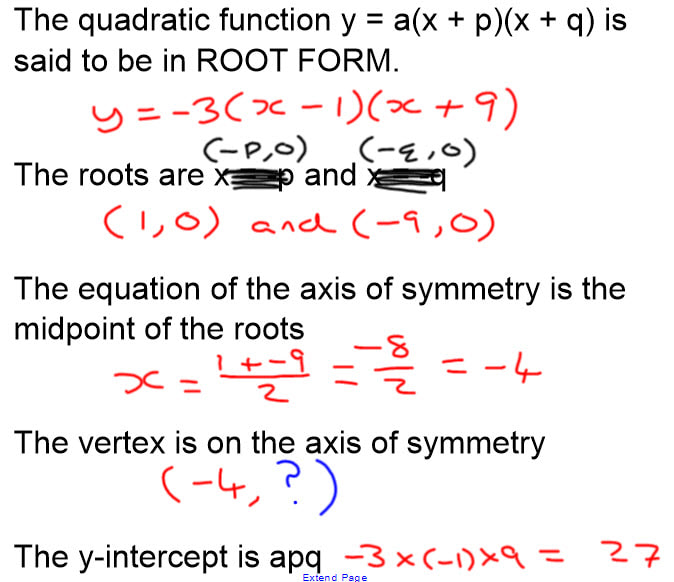
Again we formalised the discussion in their notes with the following slide.
As the bell drew closer, I sketched a few graphs on the board and Cold Called students to say what the equation would be. In future we will be looking at extending this to include finding the value of the coefficient of x² for a given graph, and then making use of this Geogebra applet (http://www.interactive-maths.com/quadratic-graphs-activity-ggb.html) I made a couple of years ago for this very reason.
Overall, I felt the second approach worked really well. All students, even those who are currently failing the course, were able to be successful in this topic, which is one of the most difficult on the syllabus. In future, I think I would still do both of these activities, but in the opposite order, only getting students to sketch the graphs after being successful at finding the points. I think this will lower the intrinsic load of the activity, as they can master finding the points first, and then put this into practice when sketching graphs.
 RSS Feed